Folks always look toward moving average lines as places where support or resistance might show up. I prefer to look at not just where the moving average is, but what its direction. The direction of the moving average is key.
Rallying from below a down-trending moving average tends to be more resistance than an up-trending one. A moving average represents the average price someone has paid to own that stock, index or asset over a period of time. So, if that moving average line has been broken as a decline unfolds, we will tend to assume that once folks "get back to even" they will be happy to sell.
A moving average represents the average price someone has paid to own that stock, index or asset over a period of time. So, if that moving average line has been broken as a decline unfolds, we tend to assume that once folks "get back to even" they will be happy to sell.
Let's look at the S&P 500 now using the very well-watched 50- and 200-day moving average lines. I tend to think of the 50-day as an intermediate term and the 200-day as a longer-term guide. Fifty trading days ago was in the late January, early February time period. This was as most indexes were still trading up near their highs.
Two hundred trading days ago was late June, when the S&P was trading around 3000.
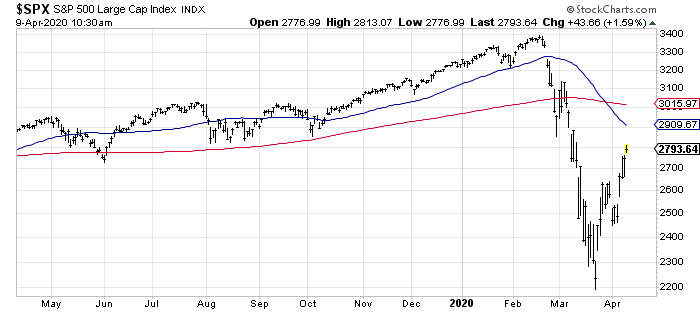
Let's talk about the 50-day moving average first. As you can see the S&P is currently trading where it was in mid-March. As 50-trading days ago was early February, then unless the S&P is going to rally and cruise through 3000 in a hurry, it is likely that the 50-day moving average will continue on a downward path for about a month more. Approximately six weeks from now it will start dropping all those prices from mid- to late March. That would be the point in time that the moving average would begin to flatten out or even curl back up.
The 50-day moving average is currently around 2900 -- see the blue line on the chart. The 200-day moving average is around 3000 at the red line, but it moves much more slowly. So let's just say that the 2900-3000 area on the S&P is a likely place that folks would feel they have gotten back to "even," and thus that would be resistance.
That doesn't mean we'll get there, but if we do I would expect it to be resistance on the first time up.
Now let's consider the timing. Let's say that resistance area is achieved in the next two to four weeks. It is possible, even likely, that the intermediate-term indicators I follow would get back to an overbought reading sometime in that time frame. It is also possible that by then, in two to four weeks, we could see sentiment with a big shift back to bullishness.
Think about it. The AAII bulls are already at 36.6%. If the market doesn't back off much before next week, they are likely to be well into the 40s by then. And the bears? They are still high at 44.7%, but another week or two and they could be in the 30s, which would take that 4-week moving average right back down. When you replace 50% with 30% it falls fast.

But my point in this exercise is that if we get the retest a month or two from now, the 50-day moving average could be flat, not pointing down as it is now, and wouldn't that make it easier for the market to get over it? And having already accommodated those who wanted to sell to "get even" resistance would not be as challenging.
I grant you there are a lot of moving parts in this scenario, but trying to figure out how the moving averages play into it is just part of the analysis.
Happy Easter to those who celebrate!
"looking" - Google News
April 10, 2020 at 06:00PM
https://ift.tt/2x8d1Cp
When Looking at Moving Average Lines, Direction Is Critical - TheStreet
"looking" - Google News
https://ift.tt/2tdCiJt
Shoes Man Tutorial
Pos News Update
Meme Update
Korean Entertainment News
Japan News Update
Bagikan Berita Ini


0 Response to "When Looking at Moving Average Lines, Direction Is Critical - TheStreet"
Post a Comment